
Since the early 1600's, astronomers have observed and recorded of the number of solar flares or sunspots that occur on the surface of the sun. Beginning in 1826, Heinrich Schwabe, a German amateur astronomer, daily observed the sun and recorded the number of sunspots. He was the first to suspect a regular variation of 11 years between relative maximum numbers of sunspots (which vary periodically from a minimum of about 10 per year to a maximum of about 110 per year). Between the maximums that occurred in the years 1750 and 1948, there were 18 complete cycles.
Problem Statement
Input/Output Description
Mathematical Equation
where s is the number of sunspots in a year and t is the year, is a curve which closely fits the observed number of sunspots.
Algorithm
c       The following program will 1) find the number of sunspots for the
c       years 1850-1975 2) write those results to a file called
c       pspots.dat with the year followed by the number of sunspots
c	during that year 3) calculate the difference between the recorded
c	number of sunspots (stored in a data file called ospots.dat)
c	and the number of sunspots predicted by the given equation and 4)
c	write those differences to a file called diffs.dat.

        PROGRAM sunspot

        REAL pi,sunspots, actual, predicted, diff
        INTEGER year, count

c	The OPEN statements connect the files pspots.dat, ospots.dat,
c	and diffs.dat to the program using the unit numbers that
c	correspond to the files.
c		ospots.dat - input file consisting of 126 lines of data
c			     with a year and observed number of sunspots
c			     on each line
c		pspots.dat - output file for the year and predicted
c			     number of sunspots
c		diffs.dat -  output file for the year, predicted and
c			     actual number of sunspots, and the
c			     differences in the two

        OPEN (UNIT=10, FILE='pspots.dat')
        OPEN (UNIT=15, FILE='ospots.dat', STATUS='new', ERR=100)
        OPEN (UNIT=20, FILE='diffs.dat')

        pi=3.141593

c       Use a do loop and the equation s=60+50cos(2pi/11(t-1948)) to find
c       the predicted number of sunspots for the years 1850 to 1975.

        DO 25 year=1850, 1975
                sunspots = 60+50*cos((2.0*pi/11.0)*(year-1948))
                WRITE (10,*) year,sunspots
 25     CONTINUE
        REWIND (UNIT=10)

c       Calculate the difference between the actual number of sunspots
c       observed in a year (stored in a data file called ospots.dat) and
c	the number of predicted sunspots (calculated by the equation
c	above) and write those differences to a file call diffs.dat.

        DO 30 count=1,126
                READ (10,*) year, actual
                Read (15,*) year, predicted
                diff = actual - predicted
                WRITE (20, *) year, actual, predicted, diff
 30     CONTINUE
100     PRINT *, 'ERROR'
        STOP
        END
To read from or write to a data file during the execution of a program, the file must first be opened with the statement
There were three data files opened in the example program
	OPEN (UNIT=10, FILE='pspots.dat')
        OPEN (UNIT=15, FILE='ospots.dat', STATUS='new', ERR=100)
        OPEN (UNIT=20, FILE='diffs.dat')
The OPEN statement
The OPEN statement may also contain other specifications that are optional but useful in some cases.
After execution of a program, data files are automatically closed. If you want to close a file before the program ends, use the statement
Notes about reading data from a file:
There are several different techniques for reading data from a file.
In the example program, the file pspots.dat is first written to (each record contains the year and number of predicted sunspots). When the last record in the file is added, the record pointer is at the end of the file. Later in the program this same file is read from when calculating the difference in the number of recorded and predicted sunspots. Therefore, the record pointer must be repositioned to the first line of the file. This is done with the statement
Example
Two other statements used when working with data files are the BACKSPACE statement and the ENDFILE statement.
1. Create a data file called ospots.dat for the years 1950-1993. Enter and modify the example program to read the number of sunspots for the years 1950-1993, find the predicted number of yearly sunspots and the difference between the recorded and predicted number of sunspots. After execution of the program, examine the contents of diffs.dat and answer the following questions:
More information on sunspot numbers
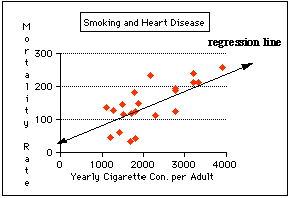
2. Table 1 lists 21 countries with the cigarette consumption per adult per year and the number of deaths per 100,000 people per year from coronary heart disease (CHD). The scatter plot of the number of deaths versus cigarette consumption indicates a linear relationship between the two.

The formulas for the slope and y-intercept of the regression line are given below (n is the number of given data points). Example (finding the slope and y-intercept of the regression line of a set of given data)


