
The subscripts are consecutive integers, usually beginning with 1; they can be an integer constant, integer variable, or integer expression. An array with one subscript, a one-dimensional array, can be visualized as one row or column of elements. For example, an array called height that consists of 8 elements could be visualized as follows:
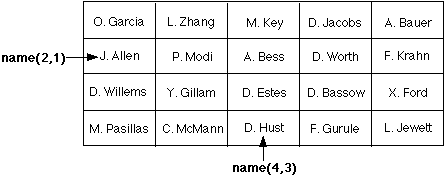
An array with two subscripts, a two-dimensional array, can be visualized as a rectangular arrangement of elements; the first subscript references the row, the second the column. For example, the array called names contains the names of students in four classes. The first subscript refers to the number of the class (1 through 4), the second subscript refers to the number of the student in that class (1 through 5). The value stored in each element is a character value.

Two-dimensional arrays are very useful in working with matrices since a matrix is also a rectangular arrangement of elements in rows and columns. The following example is a simplified version of the Leontief Input-Output Model of an economy, a model for which the economist Wassily Leontief won the1973 Nobel Prize for economics.
Example: Leontief Matrix Model
FORTRAN allows for as many as seven dimensions for an array. A three-dimensional array can be visualized as a cube whose elements have three coordinates, as in the x, y, z coordinate system. A four-dimensional array can be visualized as a row of three-dimensional arrays, and so on. There are many applications requiring up to three subscripts, but few requiring more than three.
Examples
REAL time(100)                     One-dimensional real array with a maximum
                                   of 100 elements

INTEGER count(20,10)               Two-dimensional integer array with 20 rows
                                   and 10 columns, a maximum of 200 elements

CHARACTER *20 studnt(35)           One-dimensional character array with  at most
                                   35 elements, where 20 is the maximum number of
                                   characters to be stored in any element

CHARACTER studnt(35) * 20          Another way to write the above character array

REAL totals(10,20), averg(10), pi  A two-dimensional real array called
                                   totals with 10 rows and 20 columns,
                                   a one-dimensional real array called averg
                                   with 10 elements, and a real variable
                                   called pi
To use subscripts beginning with an integer other than 1, give the first subscript and the last subscript separated by a colon. For example,
Examples
INTEGER pop(1900:2000)            declares a one-dimensional integer array
                                  whose elements are pop(1900), pop(1901),
                                  pop(1902), ..., pop(2000). The array pop
                                  has 2000-1900+1 or 101 elements.

REAL motion(0:50, 51, 51)         declares a three-dimensional real array
                                  whose first subscript goes from 0 to 50
                                  and whose second and third subscripts go
                                  from 1 to 51.  The first element of this
                                  array is motion(0,1,1) and the last element
                                  is motion(50, 51, 51). The array motion has
                                  51*51*51 or 132,651 elements.
Note that in all these declarations, the specifiers for size and first/last subscripts are constants. A variable may not be used because the compiler must be told how many memory locations to allocate, an allocation that is performed before the program runs.
A parameter statement may be used to assign a name to a constant which is then used as the size of an array. Notice that the PARAMETER statement appears after numdat has been declared type
INTEGER and before numdat is used as a subscript value.
Arrays can also be explicitly declared by using a type and DIMENSION statement, as the following example shows:
The DIMENSION statement is a nonexecutable statement and must be placed before any executable statements in a program.
Values can be assigned to array elements with assignment statements.
INTEGER j, k, kount(20)
REAL rate, veloc(20), time(30), dist(30)

veloc(0)=60.5                 assigns the value 60.5 to the element veloc(0)

kount(j) = kount(j-1) + 1     adds 1 to the value of kount(j-1) and assigns
                              the sum to kount(j)

dist(k) = rate * time(k)      multiplies the value of time(k) by the value
                              of rate and assigns the product to dist(k)
Note that an integer variable may be used as a subscript in an assignment statement. Make sure that the subscript represents an integer that falls within the specified range. In the example above, j must be an integer between 2 and 20, inclusive, while k must be between 1 and 30, inclusive. Can you explain why?
The DATA statement can be used to give array elements their initial values.
The five elements of the one-dimensional integer array moves are given an initial value of 0 (5*0 could have been used in place of the five zeros) and the 100 elements of the two-dimensional real array grid are given an initial value of 1.0. Remember that the DATA statement may appear anywhere after the type statements, but must appear before the first executable statement that uses the variable. DATA statement initializations occur only once, just before the program begins execution.
Because arrays often contain many elements, the DO loop is a powerful tool used in processing arrays. The following program makes use of assignment statements within DO loops.
Example: Gestation Period and Life Span of 22 Animals
        DO 100 k = 1, numdat
           READ (20,*) animal(k), gest(k), life(k)
100     CONTINUE
An implied do loop could be used instead.
The implied do loop will read all the data on a line before going on to the next line of data.
To print the contents of arrays animal, gest, and life a DO loop or implied do loop could be used. View both to see the difference in the two.
Whole arrays can also be read or printed by using the name of the array with no subscript. This is the only situation in which whole-array operations are allowed. If the names of the animals, the gestation periods, and the life spans had been read into three data files, names.dat ,gest.dat, and life.dat, the READ and PRINT (or WRITE) statement could have been used in the following manner:
c       The following program will read the data from names.dat, gest.dat,
c       and life.dat into arrays animal, gest, and life by using the name
c       of the array with no subscript.  It will prints the contents of each
c       array in the same manner.

        PROGRAM format

c       Type statements

        PARAMETER (numdat = 22)
        INTEGER gest(numdat), life(numdat)
        CHARACTER*15 animal(numdat)

c       Opens the three data files, names.dat, gest.dat, and life.dat

        OPEN(UNIT=20, FILE='names.dat')
        OPEN(UNIT=30, FILE='gest.dat')
        OPEN(UNIT=40, FILE='life.dat')

c       Reads the data from the three data files into the arrays animals,
c       gest, and life.

        READ(20,*) animal
        READ(30,*) gest
        READ(40,*) life

c       Prints the contents of each of the arrays to the screen.

        PRINT *, animal
        PRINT *, gest
        PRINT *, life

        END
Notice that the output is written horizontally until all values have been printed.
Bear           Cat            Chicken        Cow            Deer
Dog            Duck           Elephant       Fox            Goat
Groundhog      Hippopotamus   Horse          Human          Kangaroo
Lion           Monkey         Pig            Rabbit         Sheep
Squirrel       Wolf

 210  63  22 280 250  63  28  624  57  151  32  240  336  278  36  108 205
 116  33  151  44  61
 23 11  8  11 13  11  10  35  9  12  7  30 23  73  5  10  14  10  7  12  9
 11
Something unexpected happens when you PRINT the elements of a two-dimensional array.
Example
0   0   0   0   0   1   2
3   4   5   6   7   8   9
10  11  12  13  14  15  16
17  18  19  20  21  22  23
24  25  26  27  28  29  30
c       June95.dat contains the dates of June, 1995 (with zeros for days
c       that are not in June). These dates will be read into a two-dimensional
c       array call june whose contents will be printed.

        PROGRAM junecal

c       Specification statements

        PARAMETER (weeks=5, days=7)
        INTEGER june(weeks,days)

        OPEN(UNIT=50, FILE='June95.dat')

c       The contents of June95.dat are read into the array june.

        DO 200 week = 1,weeks
           READ (50,*) (june(week,day), day=1,days)
200     CONTINUE

c       The contents of the array june are printed.

        PRINT *, june
        END

Output

  0  3  10  17  24  0  4  11  18  25  0  5  12  19  26  0  6  13  20  27
0  7  14  21  28  1  8  15  22  29  2  9  16  23  30
What happened? Instead of the whole array PRINT statement displaying the values of each row, it printed the values in the first column and then the values in the second, third, fourth, fifth, sixth, and seventh columns. It displayed the elements of the array in the order of their storage in main memory. The following summarizes the order of storage of array elements:
INTEGER threed(2,2,2)

cell #1 contains threed(1,1,1)
cell #2 contains threed(2,1,1)
cell #3 contains threed(1,2,1)
cell #4 contains threed(2,2,1)
cell #5 contains threed(1,1,2)
cell #6 contains threed(2,1,2)
cell #7 contains threed(1,2,2)
cell #8 contains threed(2,2,2)
As you begin to use arrays in programs, it is likely that you will see new kinds of errors. The following is a list of things to check as you debug:
1. The program stats.f (from the gestation/lifespan example) used the selection sort to order the elements of the arrays gest and life before finding their medias. Find the median for each set of data again, this time using the bubble or insertion sort. Here is the output of the stats.f program
2. Using the data from animals.dat, make a scatter plot with the gestation period on the horizontal axis (x) and the average life span of the animals on the vertical axis (y).
b) Draw a line which seems to come the closest to fitting the data. Use the coordinates of two points that are on that line to find the equation of the line (y = mx + b, where m is the slope and b is the y intercept).
c) Using the linear regression method, find the slope and y intercept of the linear regression line, the closest fitting line. Compare the slope and y intercept to those in the equation you wrote in part b.
d) For each of the gestation periods (x), use the equation found in part c to determine the predicted life span (y). This (x,y) point is the point that is on the regression line. Which data points are furthermost from this line? Can you give an explanation for these outliers?
e) Extra: Some of the animals have an incubation period (time from when an egg is laid until it hatches) instead of a gestation period (length of pregnancy). Separate the animals into two groups, those with an incubation period and those with a gestation period and go through steps a through f. Do the two equations found "fit" their respective data better than the equation found in part c?
3. The Leslie Matrix: a matrix used in the calculation of the growth of populations within specific age groups. (Barnett et al, pp. 270-271)
| Age (in months) |
0-3 | 3-6 | 6-9 | 9-12 | 12-15 | 15-18 |
|---|---|---|---|---|---|---|
| Number of Females |
14 | 8 | 12 | 4 | 0 | 0 |
To predict the population in a given number of months, you also need to know the birth and death rate for each of the groups. The birth rate depends on factors such as length of pregnancy, average number of newborns in a litter, and the probability that a female in a specific age group will become pregnant. A birth rate of 0.3 means that an animal population of 100 will produce 30 newborns. The birth rates given in the table below represent the average number of daughters born to each female in the population during a specific time interval.
| Age (in months) |
0-3 | 3-6 | 6-9 | 9-12 | 12-15 | 15-18 |
|---|---|---|---|---|---|---|
| Birth Rate | 0 | 0.3 | 0.8 | 0.7 | 0.4 | 0 |
| Death Rate | 0.4 | 0.1 | 0.1 | 0.2 | 0.4 | 1 |
| Survival Rate | 0.6 | 0.9 | 0.9 | 0.8 | 0.6 | 0 |
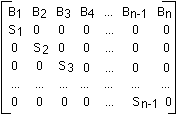
The general form of a Leslie matrix is

where Bn is the birth rate and Sn is the survival rate for the nth age group.
Example
To find the population after 3 months, one cycle, in each age group for the example above,multiply the Leslie matrix (L) times the beginning population matrix (P0).

When you multiply the first row of the Leslie matrix times the column in the population matrix, you are multiplying the birth rate of each age group times the corresponding population of that age group and adding those products together. That sum is the number of births from each age group which becomes the population of the 0-3 month group after 3 months. When you multiply the second row of the Leslie matrix times the column of the population matrix, you are multiplying the survival rate of the 0-3 month group times the corresponding population of that group (all other products in that multiplication are zero) which results in the number in the 0-3 month age group that survived to become part of the 3-6 month age group. Notice the same type of results occur as you multiply each row of the Leslie matrix times the column of the population matrix.
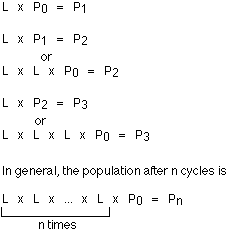
How would you find the populations after 6 months? You could take the Leslie matrix (L) times the population matrix at the end of the first cycle (P1), L x P1, or since P1 is the product of L and P0, you could multiply L x L x P0 to get P1.

where n is the number of cycles. In this problem a cycle is 3 months, so 4 years, for example, would be 16 cycles.
Write a program that will find the age specific populations after n cycles. Allow the user to input n. Use arrays to represent both the Leslie and population matrices.


